Generation of human-aware navigation maps using graph neural networks
Contributors: Daniel Rodriguez-Criado, Pilar Bachiller-Burgos and Luis J. Manso
This work builds on top of the project in SNGNN and exetends it to generate 2D disruption maps for Human-Aware Navigation (HAN) using graph neural networks.
While SNGNN could only generate a single score for scneario, this new model (SNGNN2D) can yield a entire disruption map of the space around the robot that can be use for HAN.
It is worth noting that SNGNN is also campable of generating these 2D maps by querying the model for every possible position of the robot in the scneario, generating 1 pixel value of the final map per position.
However, this process is too slow due to the large number of queries required to generate the full map.
Generating a map using this approach takes approximatelly
Although, SNGNN cannot efficiently generate 2D maps, we use this model too bootstrap a 2D dataset that can be used to train SNGNN2D as ecpplained in this section. The following video shows the proccess to create the dataset, train the model, and generate the maps in a simulated scenario for HAN:
Thus the main contributions of this work are two-fold:
- a.) A technique to bootstrap two-dimensional datasets from one dimensional Datasets.
- b.) SNGNN-2D, an architecture that combines Graph Neural Networks (GNN) and Convolutional Neural Networks (CNN) to generate two dimensional cost maps based on the robot’s knowledge.
After training, the resulting ML architecture is able to efficiently generate cost maps that can be used as a cost function for Human-Aware Navigation. The experiments presented in the published article provide the accuracy of the model, time efficiency and statistical information of the trajectories used by the robot when using SNGNN2D and a reference Gaussian Mixture Model-based (GMM) algorithm. The software to bootstrap the two-dimensional dataset and SNGNN2D has been released as open-source in a public repository, with all the data required to replicate the experiments.
Dataset bootstrapping
The acquisition of two-dimensional cost or disruption maps to create datasets for learning purposes generates a number of challenges. First, asking people contributing to the datasets to provide a cost map instead of a single score per scenario would be more time-consuming. Another factor to consider is the precision of the answer is being dependent on the subjects’ capability to represent their preferences graphically. Their inclination and motivation to stay engaged in the task would also be a challenge.
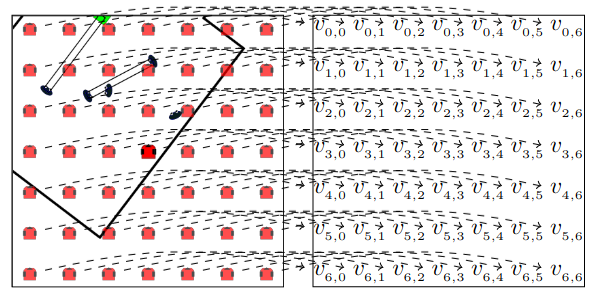
Fig. 1 The process used to bootstrap the two-dimensional dataset. The expected 2D outputs are generated performing multiple queries to SNGNN, shifting the scenario around the robot.
A dataset containing scalars as output data cannot directly be used to train a model which provides a two-dimensional output, so the approach followed in this case is to use a model which provides single value estimations (SNGNN) and sample its output shifting the robot’s position, bootstrapping this way a two-dimensional dataset.
The process of sampling is depicted in Fig. 1 and in more detail in the cover video.
For each scenario in the bootstrapped dataset a matrix of
Graphs creation
Considering that the input data is not presented in the form of a graph, its conversion to a graph-like structure is one of the most relevant steps if GNNs are to be used.
This process follows the same steps as (SNGNN), with the exception that there is an additional grid of
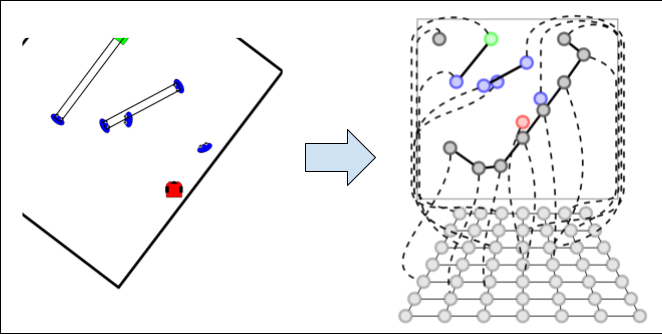
Fig. 2 Representation of the graph corresponding to a specific scene. On the left image, the top side shows the entity graph while the bottom side depicts the grid graph.
The grid is a lattice of interconnected nodes, structured to represent the area of the room surrounding the robot by associating them to 2D coordinates.
The number of nodes of this grid and the area they cover are hyperparameters that can be tuned to reach a trade-off between performance, computation time, and area coverage.
The
How to use
Explained how the model works and its structure, this section will focus on the usage of the model.
Load the model and the dataset
The first step to use the model is to download it alongside with the dataset. To clone the repository of the project in your computer simply run:
git clone https://github.com/gnns4hri/sngnn2d.gitcd sngnn2dThe repository already includes a trained model, the dataset and a docker container to run the model.
Train your own model (optional)
If you just want to test our trained model, you can skip this section. However, if you want to train or fine tune your own model, you can follow the steps below.
-
You can use the same dataset split that we used that is located in the
datafolder. Each JSON file in that folder contain a list of scenarios, each scenario is a dictionary with the following keys (this is an example of a scenario entry):{"identifier": "00108 B","score": 72,"robot": {"id": 0},"humans": [{"id": 1, "xPos": -189, "yPos": 98, "orientation": -150}, {"id": 3, "xPos": -339, "yPos": 157, "orientation": -1}, ...],"objects": [{"id": 2, "xPos": -297.5, "yPos": 285.9275126212232, "orientation": 30}],"links": [[1, 2, "interact"], [3, 4, "interact"], ...],"room": [[-239, 461], [-129, 371], [-112, 392], [382, -16], [365, -37], [368, -39], [117, -343], [114, -341], [-29, -517], [-526, -110], [-380, 66], [-490, 156], [-239, 461]]}The identifier key os a iunique name for the scene that coincides with the name of the image file in the
images/allfolder. The models use this naming convention to locate de images during training and testing. The rest of the keys provides information about the entities in the scene. Follow the same format to create your dataset or add data to the existing one. -
Now to train a new model you just have to run the training script as follows:
Terminal window python3 train.py
Test the model
To test the model you have two options available: you can use the Docker images provided in the repo or you can use the scripts. We recommend to use the Docker images as they are easier to use and they include all the necessary dependencies.
Using Docker containers (recommended)
To visualize the results of the model, we provide a docker container that includes all the necessary dependencies to run the model. To run the container you just have to run the following command:
cd docker/cuda_test./run.shTo run the model in a simulated environment, run the following command:
cd docker/cuda_navigationdocker build --tag 'sngnn2d' .Using scripts
For this option you first need to install all the dependecies of the project. Then you can run first the simulator and then the model that you want to test:
cd testbash simulator.shbash run.sh #For SNGNN2Dbash run_araceli.sh #For GMMsCitation
To cite this work, use the following BibTex notation:
@InProceedings{danielGraph2D,author="Rodriguez-Criado, Danieland Bachiller, Pilarand Manso, Luis J.",editor="Bramer, Maxand Ellis, Richard",title="Generation of Human-Aware Navigation Maps Using Graph Neural Networks",booktitle="Artificial Intelligence XXXVIII",year="2021",publisher="Springer International Publishing",address="Cham",pages="19--32",isbn="978-3-030-91100-3"}