SocNav2 - A Dataset to Benchmark and Learn Social Navigation Conventions (version 2)
Contributors: Pilar Bachiller, Daniel Rodriguez-Criado, Ronit R Jorvekar, Pablo Bustos, Diego R Faria and Luis J Manso
SocNav1 was developed to learn and benchmark disruption estimation functions for social navigation. SocNav2 shares the same objective as its predecessor; however, it incorporates the velocity and trajectory of the robot and surrounding humans among other advantages. Like SocNav1, SocNav2 contains scenarios with a robot in a room, alongside various objects and individuals who may potentially interact with other objects or people. In SocNav2, the room also includes a landmark that constitutes a goal position to be reached by the robot. Any existing human-human or human-object interactions are noted in the scenarios. However, unlike in SocNav1, these notes contain semantic information indicating the nature of the interaction and the interactions are not limited to entities facing each other. For instance, there is a type of interaction of two or more humans walking together.
SocNav2 provides 13,406 scored samples of dynamic scene sequences. Each sample consists of 35 “snapshots” of a scene of a room with a moving robot, objects and potentially moving humans, taken during a time interval of 4 seconds. Each SocNav2 sample includes scores for two social navigation-related statements: “the robot does not cause any disturbance to the humans in the room” Q1 and “the robot is moving towards the goal efficiently, not causing any disturbance to the humans in the room” Q2. The scores range from 0 to 100, considering the following reference values:
- 0: Unacceptable
- 20: Undesirable
- 40: Acceptable
- 60: Good
- 80: Very good
- 100: Perfect
Generation of the dataset
The scenarios compiled in SocNav2 have been generated using SONATA. SONATA is a toolkit built on top of PyRep and CoppeliaSim, designed to simulate human-populated navigation scenarios and generate datasets. It offers an API to generate random scenarios, incorporating humans, objects, interactions, the robot, and its goals. The walls delineating a room are also randomly generated, considering both rectangular and L-shaped rooms. While SONATA exclusively provides simulated scenarios, the use of synthetic data is crucial in the context of social navigation. This is primarily because generating a comparable number of situations using only real-world data would be infeasible. Furthermore, scenarios that jeopardise human safety, such as human-robot collisions, cannot be ethically performed in real-world settings.
The robot’s movements were generated using two distinct strategies to enhance the diversity of its behaviour. The first strategy employs a machine learning model (see SONATA) that outputs the robot’s control actions based on a graph representation of the scenario. This model was trained using supervised learning (i.e., containing only examples of appropriate behaviours), which results in unexpected behaviours in situations that do not typically occur when controlled by humans. However, for the creation of SocNav2, these behaviours facilitate the generation of a broad range of favourable and unfavourable situations that would not have emerged from random actions. In addition to the samples where the robot’s movement was controlled by the machine learning approach, a second set of samples was generated using a joystick for manual control of the robot. This second set was designed to encompass infrequent situations not present in the first set, such as the robot moving backwards to avoid being blocked or stopping to allow people to pass.
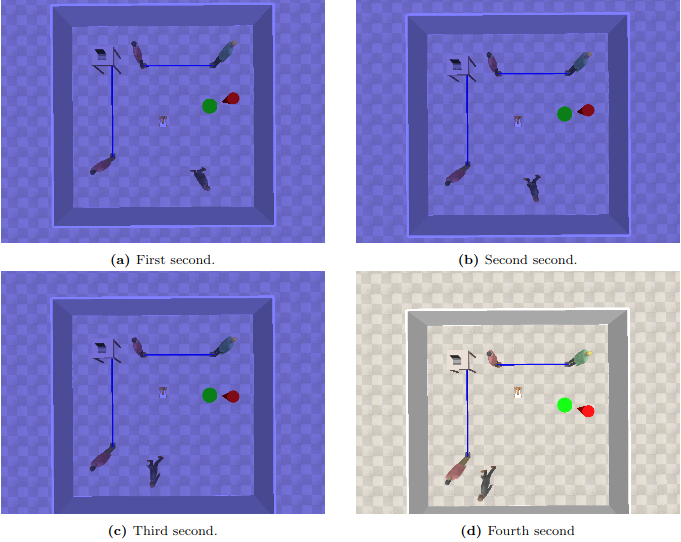
Fig. 1 A SocNav2 sequence. The shaded images correspond to the first 3 seconds of the sequence, which are also shown to subjects to provide context. The last image corresponds to the second that the users score. During the whole sequence, the robot is moving forwards.
Subjects providing scores for SocNav2 were presented with 4-second sequences and asked to evaluate the robot’s behaviour during the final second. The video was shaded during the initial three seconds to facilitate the identification of the specific time slice to be assessed (see Fig. 1). The geometrical and relational data of the sequences were stored in JSON files. After watching the video (as many times as necessary), subjects were asked to provide a score for Q1 and Q2 based on the reference values provided. Although some guidelines were given, subjects were encouraged to freely express their opinions. The guidelines included:
- Disregard the goal when answering
Q1. It should only be considered when answeringQ2. - The closer the robot gets to people, the more it can be considered disturbing.
- In smaller rooms with a higher number of people, closer distances are more acceptable compared to larger rooms with fewer people.
- The robot must avoid colliding with objects or walls. If it collides, it should receive a score of 0.
Resulting data
Six subjects participated in scoring the dataset, yielding a total of 13,406 scored samples. This initial set of samples was expanded through data augmentation. Specifically, each scenario was mirrored along the vertical axis, assuming the same scores as in the original scenario. Moreover, each raw and mirrored scenario was rotated by 180°, with the robot’s advance speed sign also being changed. This extension assumes that human discomfort remains unchanged regardless of whether the robot is moving forwards or backwards. Consequently, the data augmentation process resulted in a final dataset comprising 53,600 samples.
| Subject1 | Subject2 | Subject3 | Subject4 | |
|---|---|---|---|---|
| Subject1 | 0.83 | 0.75 | 0.80 | 0.56 |
| Subject2 | 0.75 | 0.88 | 0.85 | 0.63 |
| Subject3 | 0.80 | 0.85 | 0.88 | 0.62 |
| Subject4 | 0.56 | 0.63 | 0.62 | 0.81 |
| Subject1 | Subject2 | Subject3 | Subject4 | |
|---|---|---|---|---|
| Subject1 | 0.74 | 0.68 | 0.72 | 0.57 |
| Subject2 | 0.68 | 0.71 | 0.74 | 0.63 |
| Subject3 | 0.72 | 0.74 | 0.76 | 0.64 |
| Subject4 | 0.57 | 0.63 | 0.64 | 0.73 |
To analyse the consistency of the dataset’s scoring, the inter-rater and intra-rater agreements were computed for four subjects using the linearly weighted kappa coefficient (J. Cohen). For the inter-rater consistency, common samples scored by each pair of subjects were considered, with a minimum of
As demonstrated in the first table, the intra-rater consistency for Q1 is “almost perfec” according to the scale defined in R. Landis et al. The inter-rater agreement for Q1 can be considered substantial in most cases, with only subjects 1 and 4 having a lower agreement, which still falls within the high “moderate” range. The second table reveals that the consistency for Q2 is generally lower than for Q1. This decrease can be attributed to the question’s nature, as subjects may vary significantly in their opinions about how the robot should “efficiently” reach the goal position. Nonetheless, the inter-rater and intra-rater consistency remains “substantial”, except for subjects 1 and 4, which are considered high “moderate”.
How to use
The dataset is public and can be downloaded from this link. It contains several JSON files with the information of the scenarios and its labels. Hence, each file stores data for several consecutive frames of the simulation which correspond to one label. Notice that there are 3 txt files in the raw data directory. These are provided in case you want to use the same split for training used in SNGNNv2.
Citation
To cite this work, use the following BibTex notation:
@article{bachiller2022graph, title={A graph neural network to model disruption in human-aware robot navigation}, author={Bachiller, Pilar and Rodriguez-Criado, Daniel and Jorvekar, Ronit R and Bustos, Pablo and Faria, Diego R and Manso, Luis J}, journal={Multimedia Tools and Applications}, volume={81}, number={3}, pages={3277--3295}, year={2022}, publisher={Springer}}